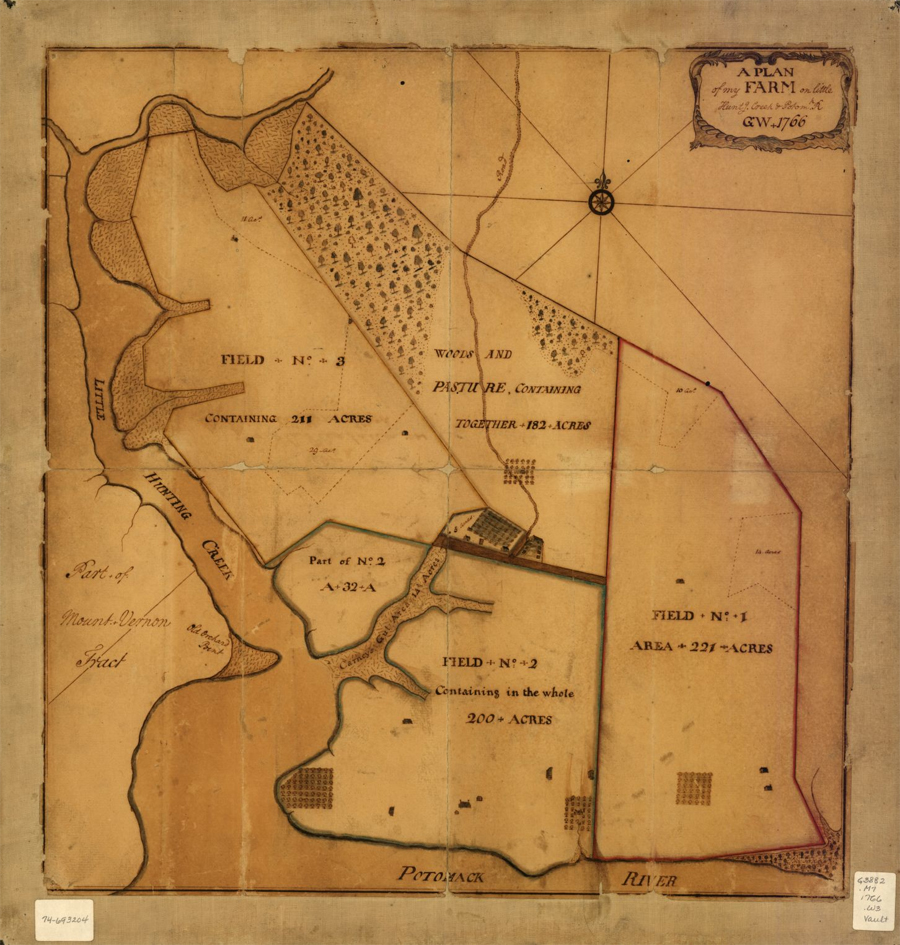
Guided Primary Source Analysis: A Plan of My Farm
Zoom into this old map. Do some math, how many acres in total are listed on this map. There are 640 acres in 1 square mile. Approximately how many square miles is this farm? Look for clues on the map to see if you can determine when it was made and by whom. Make a rough sketch of what you think the farm looked like in pencil.
Now compare the map above to another map of the same area from a later date. What changed? What stayed the same? What more did learn about the farm and the farm owner? Rework your sketch to create an illustration of the same portion of the farm that both the old map and the newer map show.
Look at a digital map of this area today. What does it look like? Create an illustration based on your analysis of the contemporary map. How does this contemporary illustration compare to your historic illustration? What did you learn about change over time in this area?
What other observations, reflections or questions does this source inspire? Let us know!

