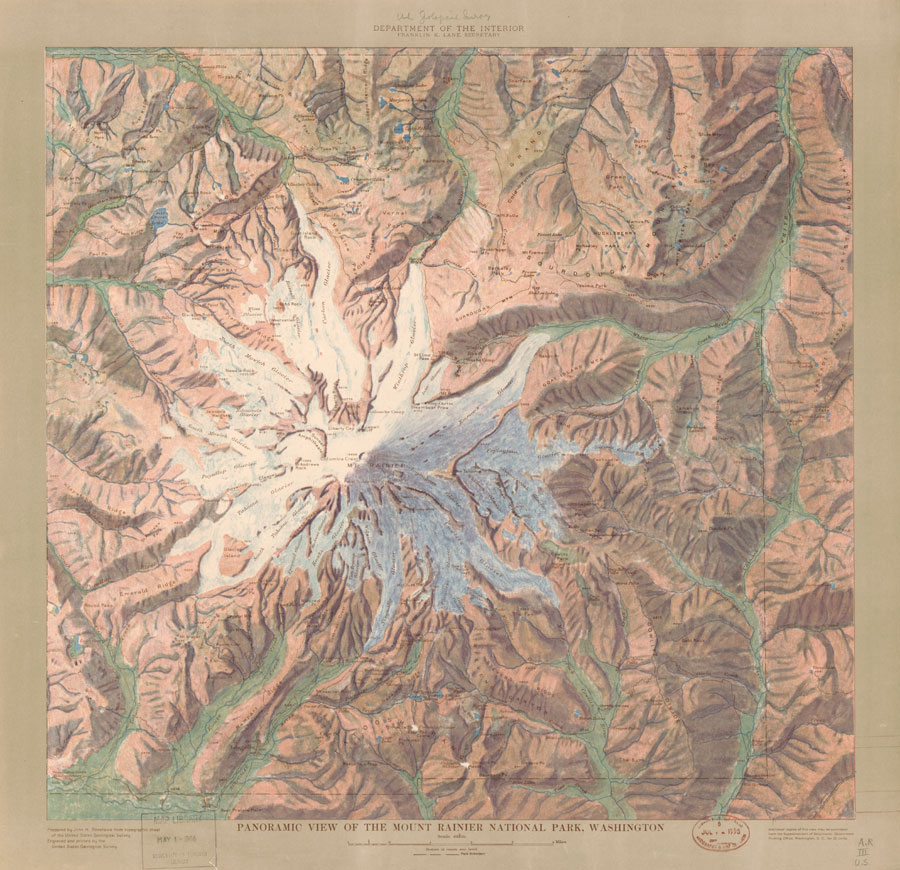
Guided Primary Source Analysis: Shrinking Glaciers
Zoom into the map and analyze it, creating a bulleted list of what you learned from your analysis and another list of any questions that you have; click the image above to access the source record.
Use the scale to trace a 1-mile square grid over the image portion of the map. Use the grid to determine a rough estimate of the number of square miles of glacier coverage, jotting down the number. Then create a square-mile grid for this timelapse map to determine rough estimates of the number of square miles of glacier coverage in 1971 and 2015, jotting down the numbers. What was the approximate square mileage of glacier loss from 1913-1914 to 1971? from 1913-1914 to 2015? What might explain the losss?
Read one of the articles linked to below and summarize what you learned. Then brainstorm or research ideas for slowing glacier loss. Share your findings and ideas with the class and with your legislators.
- Critical Mass: Washington’s Shrinking Glaciers The Nature Conservancy in Washington
- One of the snowiest places on Earth is losing its glaciers National Geographic
What other observations, reflections or questions does this source inspire? Let us know!
Related resources

