Guided Primary Source Analysis: Grand Canyon Tourist Map
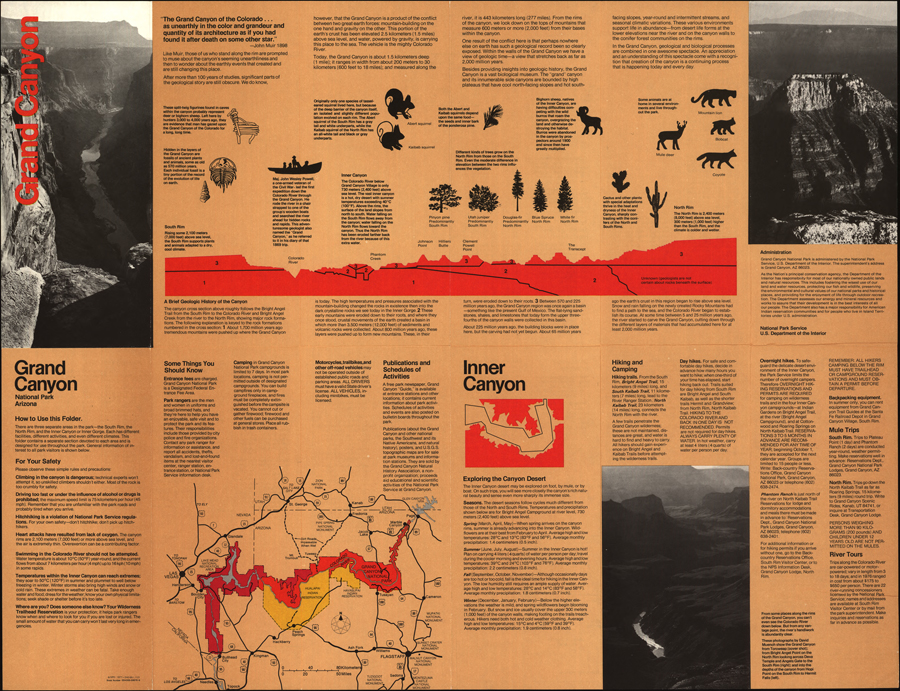
List the different data you find on this map (view larger image).
Conduct research to compare the data from this map from 1977 with current information and statistics. What similarities and differences did you find?
Investigate reasons for the change(s) in data; describe your findings.
What other observations, reflections or questions does this source inspire? Let us know!
Related resources